itrace example
The itrace example illustrates how to use the itrace library to monitor CPU and NSP activity using various profiling events.
Overview
The example illustrates how to use most of itrace features. The source is organized as follows:
main_and_utils.c- implements
main(), which parses the arguments allowing the user to exercise various itrace features - implements utility functions, all unrelated to itrace
- implements
basic_run.candbasic_imp.c, which implement a single-threaded app monitored by itraceadvanced_run.candadvanced_imp.c, which implement a multi-thread app and illustrates how to use various itrace featuresitrace_example_walkthrough.py, which automates the steps of building and running the example and illustrates compile- and link-time features of itracetests, which runs the example walkthrough with various options and checks the validity of the output
We recommend that new itrace users begin by running and reviewing the source of the basic example.
Inspecting main_and_utils.c is not useful for the comprehension of itrace and can easily be ignored.
Only when users are familiar with the basic example should they move on to understanding the various advanced run use cases.
Basic example
Workflow
The basic run performs the following actions: - A sleep cycle on the CPU - A FastRPC call to the NSP, which runs a number of for loops, each performing the same sequence of scalar float multiplications - Another sleep cycle on the CPU
itrace usage
The basic run also uses itrace to monitor various code sections from the example listed above. The example illustrates how to perform the following steps:
-
Start a logger instance from the CPU
The itrace logger is initialized by calling
itrace_open_logger. The logger is responsible for parsing the logs captured on the CPU and NSP and producing CSV, Flamegraph, gprof, and JSON files describing the CPU and NSP activity. -
Start a profiler instance on the CPU and an NSP domain selected by the user (CDSP as default)
These two tasks are accomplished by calling
itrace_open_profilerwith the desired target domain and log buffer size. -
Specify which events to monitor
The basic example configures itrace to monitor 2 NSP events and 3 CPU events using the
itrace_add_event_by_idAPI. Both NSP events are NPU events tracking respectively the number of committed packets being executed and the number of scalar float operations. -
Register events
Once the events of interested have been specified, they must be registered by calling
itrace_register_events. -
Define sections to monitor
The
itrace_start_sectionanditrace_end_sectionare used to monitor:- CPU activity for code sections defined from the CPU source
- NSP activity for code sections defined from the NSP source
- NSP activity for code sections defined from the CPU source
Note: Monitoring NSP activity from the CPU is useful for example for a user who does not have access to the NSP source or cannot easily recompile it. This approach results in monitoring NSP events for the section being defined.
itrace output
The itrace_results/json folder contains the timeline generated by itrace:

On this timeline, we clearly see one CPU thread that executed two sleep cycles and waited in the middle while the NSP was running the NSP loop. On the CDSP thread activity, clicking on Basic run DSP shows that this section consummed 4M float operations. Clicking instead on the Basic run innner loop sections shows 400K float operations, as expected.
The CDSP statistics timeline shows how the COMMITTED_PKT_ANY and COMMITTED_FPS counters increase each time they are updated, which occurs when we start or end any NSP section.
The gprof and flamegraph reports show statistics for the entire run. For example, itrace_example_gprof_CDSP__0x50_COMMITTED_FPS.txt includes the following report:
Flat profile for event 0x50  COMMITTED_FPS
     %        total           self                         total           self             total             total
 total        count          count          calls     count/call     count/call     time(ns)/call     count/time(ns)    name
100.00      4000001        4000001              4     1000000.25     1000000.25        2761783.75           0.36208     Basic run inner loop
  0.00      4000002              1              1     4000002.00           1.00       11050521.00           0.36197     Basic run outer loop
  0.00      4000002              0              1     4000002.00           0.00       13894531.00           0.28788     Basic run DSP
We see that the total counts are nearly identical for all sections since those numbers include the total counts for all iterations of the sections combined including their children functions. We also see that the self count, which exclude the children count, are nearly zero for all but the section actually consuming the float operations, Basic run inner loop.
Advanced example
The advanced example illustrates additional itrace features as well as multiple approaches for accomplishing the same task (setup, registration, monitoring, etc.).
It is not necessary to review and understand the entire example to learn about a specific feature as each illustrated feature is identified as Xn within the code and indexed in the file header.
Setup from file
It is possible to setup itrace entirely from file as illustrated in advanced_run.c (X1). This approach lets the user perform the entire itrace setup from file: specify which domains to monitor, which events to monitor on each domain, whether to use an event reader on each domain, etc.
Add and register events
Registration of events is done by calling itrace_register_events. The itrace example illustrates many ways of adding and registering events.
NSP events
Specifying which events itrace should monitor is usually done from the CPU. It is however possible to do so from the NSP as illustrated in advanced_imp.c (X2). Among other things, this approach allows to specify custom NSP events, letting a user provide their own functions for collecting metrics (X3).
To demonstrate this approach, use the -r or --register_events_from_dsp command-line argument. This will result in unregistering events previously registered on the CPU and registering new events from the NSP instead.
Load events from file
In some cases it may be desirable to specify which events to monitor from a file (X4B). This allows to monitor different sets of events without having to recompile the code for example. It may also be preferable to list events in a file rather than programmatically for the sake of readibility. This is especially handy when specifying a large number of events to monitor.
Using -f or --load_events_from_file command-line argument will pull the list of events that need to be registered from dsp_events_config.txt and cpu_events_config.txt.
Load all PMU events
Each NSP may be monitored by hundreds of devices. For users who need to re-run the same code section and monitor it with all PMUs (in groups of 8 at a time), itrace offers a way to add automatically all public PMUs supported on that device. This feature is illustrated in X4C. You may enable the feature from the walkthrough with -p or --monitor_all_pmu_events provided that you also use -m to use the multipass mode. Otherwise, all PMUs will be added to itrace but the code will be monitored only once with the first 8 PMU events.
Monitor sections
The itrace example provides multiple examples on how to monitor a code section.
Monitoring a code section consists of measuring the events registered to the profiler handle being passed at the beginning and the end of the section. This allows each itrace report to render that information in various ways, either by providing average stats on event consumption during the run of that section in the case of the Flamegraph and gprof reports, or event values for each occurence of that function in the case of the timeline reports (json or protobuf output).
Monitor NSP activity from the CPU
Monitoring NSP activity by defining a code section from the CPU is useful when the NSP source is not accessible. For example, the user may surround from the CPU a FastRPC call by using an NSP profiler handle with itrace_start_section and itrace_end_section in order to monitor NSP counters for that section (X8).
Monitor with optimizations
The itrace example also illustrates how to use the itrace_start_section_no_events and itrace_end_section_no_events APIs. These APIs are also intended to monitor code sections but they are optimized for speed and designed to only monitor the time and pcycle counts of each code sections.
Monitor variables (C++ only)
The itrace example also illustrates in advanced_cpp_imp.cpp how to use ITRACE_MONITOR_FUNCTION_CPP (X1) and ITRACE_MONITOR_FUNCTION_NO_EVENTS_CPP (X2) macros to monitor C++ functions. These macros initiate monitoring from the moment they are called until the function concludes (when the function object goes out of scope). ITRACE_MONITOR_FUNCTION_NO_EVENTS_CPP is optimized for speed and designed to only monitor time and pcycle counts, while ITRACE_MONITOR_FUNCTION_CPP also monitors registered events.
Monitor events periodically
The periodic event readers may be used to measure all registered events at regular intervals.
This is accomplished by calling itrace_start_periodic_events_reader (X7), passing a profiler instance, and specifying the sampler polling period and thread priority. Enabling event readers allows to collect more statistics for the timeline trace, since otherwise, statistic data are only updated at the start and end of a section, or when calling itrace_read_events.
Use markers
In addition to monitoring sections, itrace allows the user to insert text markers. These events will show up in the timeline and CSV reports to help the user understand when a specific runtime event happened in relationship with the sections being monitored. When itrace captures a marker, it does not measure event values.
Multipass mode
The hardware can only monitor up to 8 PMU events at a time. Beyond that, it is necessary to register multiple groups of PMU events that will be monitored one group at a time. The multipass extensions automate the process of registering successively different groups and rerunning the section of code delimited by ITRACE_MULTI_PASS_START_LOOP and ITRACE_MULTI_PASS_END_LOOP.
To demonstrate the use of the multipass extensions, use the -m or --multipass command-line argument when invoking the walkthrough and see section X10B in the code. When this option is enabled, itrace will automatically re-run the code defined between the two MULTI_PASS macros as many times as necessary to monitor all events specified by the user.
Automated setup
Using -A or --automated utilizes the prebuilt binary libritrace_constructor_skel.so to take advantage of full automation using itrace. Upon the first dlopen call in the example, the constructor binary triggers itrace setup via an itrace_automated_setup call (based on the configuration specified in itrace_config.txt). At program exit, an itrace_automated_teardown call is triggered to flush logs and cleanup the loggers and profilers that have been set up.
Notes: * This feature is an alpha feature that is intended to simplify the setup process but is not guaranteed to always work. * NSP profilers specified in the configuration file will be set up after the PD is created on the domain. Occasionally, this setup may be delayed, causing a logging delay on the specified domain, and in the worst case, it could result in a crash during configuration. * This feature is only supported on targets after Waipio.
Remote control of itrace
For remote profiling of itrace, the user must run two instances of itrace_example in separate processes as illustrated in X12. The walkthrough will launch those process automatically when using option -s or --slave, which in turns, calls successively two itrace example instances with options -s 1 and -s 2 respectively. The first instance (-s 1) prepares itrace to listen to remote messages while the second instance (-s 2) is a simple emulation of a client that will send a few remote messages to itrace to configure itrace, start and stop profiling, and terminate.
UDP messages are exchanged with IP 127.0.0.1 on ports 15501 and 15500.
Running the example
The example comes with a walkthrough script called itrace_example_walkthrough.py. Please review the generic setup and walkthrough scripts instructions to learn more about setting up your device and using the script.
To run the example, execute the walkthrough script itrace_example_walkthrough.py. This script automates the steps of building, running and signing the device. The script also pulls from the device the itrace_results folder containing all the files generated by itrace.
The example provides a script at ${HEXAGON_SDK_ROOT}/examples/itrace/tests/validation_script.py which tests all the arguments supported by the itrace_example.
Explore the arguments supported by validation_script.py using:
python validation_script.py -h
For each of the command executed using the validation_script we get:
- The standard outputs stored at
${HEXAGON_SDK_ROOT}/examples/itrace/outputsfolder. - The
itrace_resultsstored at${HEXAGON_SDK_ROOT}/examples/itrace/resultsfolder. - The
logcatlogs stored at${HEXAGON_SDK_ROOT}/examples/itrace/logcat_logsfolder.
Notes:
- itrace is not supported on the simulator
- By default, the itrace example uses the prebuilt itrace binaries provided in the Hexagon SDK for both LA and LE. To provide an alternate location for the itrace source or prebuilt binaries, set the environment variable
ITRACE_DIRaccordingly. - The toolchain supported for LE is GCC 11.3,you can download and install the toolchain following these instructions.
Visualizing the results
Event counts
when interpreting any of the itrace output files, it is important to remember that most events count resources are shared accross the entire domain. As a result, when monitoring an event on a given thread, contributions from other threads will also be counted.
For example, one of the events monitored in the itrace example is ITRACE_DSP_EVENT_PMU_COMMITTED_FPS. This event monitors the number of scalar float operations. The memcpy function that is monitored in the itrace example does not perform any float operation. However, that function may occasional run in parallel with itrace_example_float_loop and when that is the case, the memcpy function will show a positive count for ITRACE_DSP_EVENT_PMU_COMMITTED_FPS.
File names
The walkthrough script sets the itrace root filename to /data/local/tmp/itrace_results/itrace_output for LA and it sets the itrace root filename to /usr/bin/dsp_root_tests/itrace_results/itrace_output for LE. This means that the example will generate an itrace_results folder under /data/local/tmp/ for LA and under /usr/bin/dsp_root_tests/ for LE in which it will generate its various itrace output files:itrace_output.json,itrace_output.csv`, etc.
Naming conventions
itrace adopts the following naming conventions in its reports:
-
sanderefer the event counter values measured at the start and end of a section. These values are generated when the processing mode of an event is set toRAW. -
drefers to the delta between a counter value measured at the end of a section and its value at the start. This approach is used when the processing mode of an event is set toDELTA. -
d/trefers to the delta between a counter value measured at the end of a section and its value at the start divided by the section duration (in microseconds). This approach is used when the processing mode of an event is set toNORMALIZED. -
PMU event names are listed as
: where is the hexadecimal number of the event and its name. The field is omitted for PMU events registered by their opcodes and not their itrace id.
CSV report
The CSV file reports for all executed NSP sections the NSP event values that were measured. If the processing mode of an event is set to RAW, two values are reported for the event: the values measured at the start and end of the section. Otherwise, only one value is reported, derived from the difference between the value measured at the end and start of the section.
TIME_US:s and TIME_US:e refer to the start and end time (in microseconds) of a section.
>adb pull /data/local/itrace_results .

>more itrace_output.csv

CDSP v68
SECTION,TIME_US:s,TIME_US:e,:STACK_FREE_B:s,:STACK_FREE_B:e,0x50:COMMITTED_FPS:d,0x42:AXI_WRITE_REQUEST:d,0x3:COMMITTED_PKT_ANY:d,0x3f:AXI_LINE128_READ_REQUEST:d,0x46::d,0x100:HVX_ACTIVE:d
Begin test on NSP
memcpy,180647804.322917,180650377.916667,936,920,0,17103,461824,16934,16581,0
memcpy,180667918.489583,180670378.958333,936,920,0,12716,396646,16711,12696,0
memcpy,180684860.625000,180687419.062500,936,920,0,12750,396645,16700,12731,0
itrace_example_float_loop,180701943.958333,180704966.770833,5280,5240,1000000,33841,2795434,36922,30363,0
float_loop,180701941.770833,180704970.729167,5264,5240,1000000,33961,2799913,37059,30473,0
JSON (timeline) report
The JSON file captures the NSP and CPU activity on a timeline. The JSON file may be open from the Chrome browser with Perfetto by clicking on Open trace file to select itrace_output.json.
You should be able to see four sets of rows containing Statistics and Process information for the CPU and NSP.
Any of these rows can be expanded to see detailed activity:
- The CPU Statistics timeline shows the clock frequency of all CPU cores
- The CPU and NSP Process timelines show when a given monitored section is active on a given software thread
- The NSP Statistics timeline shows the registered event values measured by the sampler and at the start and end of any monitored section
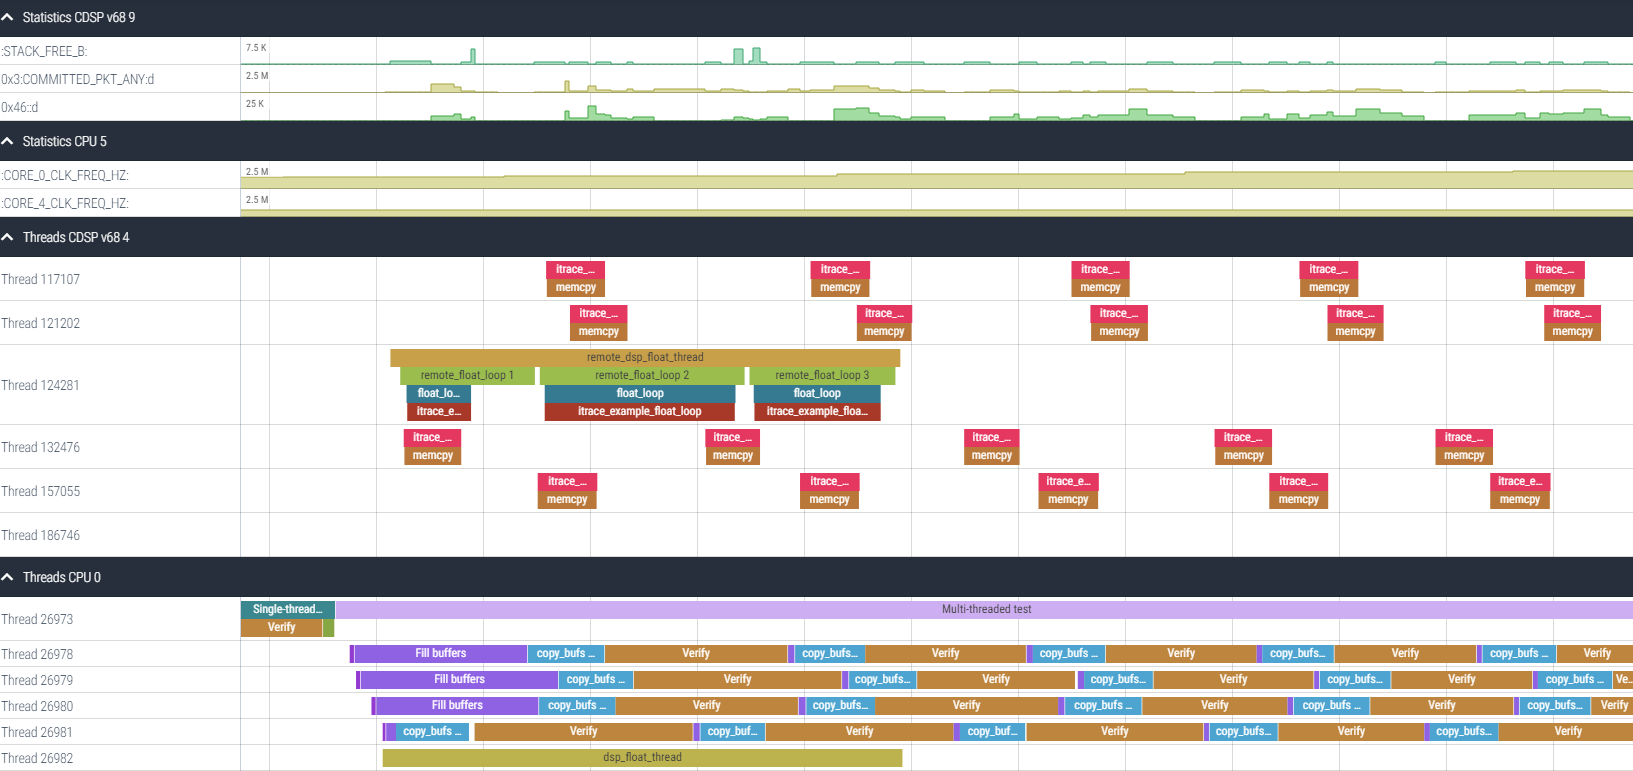
Additionally the user may click on any NSP section to obtain the same details as those reported in the CSV file for the selected section.
The CPU statistics below show for example how two of the CPU hardware thread clocks change over the duration of the test.

The NSP statistics below show how two PMU and two non PMU counters evolve over time.
Flamegraph reports
The Flamegraph files are generated in two steps:
- The
itrace_exampleexecutable generates text files in atmpfolder of the output folder - The
flamegraph_post_process.shshell script turns these text files into Flamegraph and Icicle files
Before running flamegraph_post_process.sh make sure to download the Flamegraph project. Then update FLAMEGRAPH_DIR to point to the downloaded location and also update if necessary ITRACE_RESULTS to point to the output folder generated by the itrace_example executable.
After execution of the script, you should obtain one Flamegraph and one Icicle graph for each text file present in the tmp folder. These files will provide a breakdown of resource consumption per itrace code section for each monitored itrace event.
In addition to reports on each registered event itrace will generate the following reports:
*___TIME_NS.svg: Breakdown of the time in nanoseconds spent executing each monitored section*___PCYCLES_30b.svg: Breakdown of the 30 LSBs of thepcyclecounts for all sections monitored with theitrace_start_section_no_eventsanditrace_end_section_no_eventsAPIs
gprof reports
gprof output files contain a flat profile and a call graph report similar to the gprof tool.
As with the Flamegraph output, you should be getting one gprof report for the time and pcycles metrics and each registered event that detail resource consumption for each monitored code section.
Please refer to any online documentation on gprof for more details on these reports.
Autoinstrumentation support
itrace is able to leverage compiler instrumentation features on the NSP and/or CPU side to monitor all functions of a given library.
NSP auto instrumentation
itrace leverages the Hexagon compiler Light Weight Instrumentation (LWI) feature to automatically monitor all functions in a NSP source file or library. To enable this feature in the itrace example, simply set the environment variable USE_LWI before building the code. Alternatively, you can also invoke the walkthrough script with the -L or --use_lwi option.
This will result in compiling the itrace_example project with the -fprofile-lwi-generate-func and -flwi-fp flags. This means that all NSP source of the itrace example project will have LWI enabled. As a result, all functions present in libitrace_example_skel.so will be monitored with itrace by calling itrace_start_section_no_events and itrace_end_section_no_events at the entry point and all exit points of each NSP function.The 8.7 Hexagon tools also support an additional set of attributes, lwi_func and no_lwi_func:
- Functions with the
lwi_funcattribute and compiled with flag-flwi-attrwill be monitored by itrace even when-fprofile-lwi-generate-funcis not present - Functions with the
no_lwi_funcattribute and compiled with flag-flwi-attrwill be not be monitored by itrace even when-fprofile-lwi-generate-funcis present
NSP auto instrumentation is not supported on Windows host machine.
CPU auto instrumentation
itrace leverages the CPU compiler instrumentation feature to automatically monitor all functions in a CPU source file or library. To enable this feature in the itrace example, simply set the environment variable USE_CPU_INSTRUMENTATION before building the code. Alternatively, you can also invoke the walkthrough script with the -i or --use_cpu_instrumentation option.
This will result in compiling the itrace_example project with the -finstrument-functions flag. This means that all CPU source of the itrace example project will have CPU instrumentation enabled. As a result, all functions present in the itrace_example binaries will be monitored with itrace by calling itrace_start_section_no_events and itrace_end_section_no_events at the entry point and all exit points of each CPU function.