Multithreading example
Overview
The multithreading example illustrates the following features:
- QuRT APIs:
- Threads
- Barriers
- Mutexes
- Benefits of using multithreading and L2 prefetching
- Using the walkthrough script
- Debugging on simulator
- Configuring relative thread priority of user threads on the DSP. This feature is used to create threads with a priority higher or lower than the default thread priority on the DSP.
For more information on the usage of QuRT APIs, please refer to the OS section introducing QuRT.
Refer to the Feature Matrix for example support and to know the DSP architecture on the target.
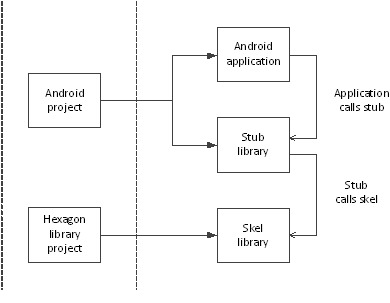
Project structure
The example demonstrates the usage of QuRT APIs for launching multiple threads, synchronizing threads with mutexes and barriers, and L2 prefetching. Here is the project flow for the multithreading example:
-
MakefileRoot makefile that invokes variant-specific min files to either build the application processor source code or the Hexagon DSP source code.
-
android.min,UbuntuARM.min,hexagon.minContain the make.d directives used to build the application processor and Hexagon DSP source code.
-
inc/multithreading.idlIDL interface that defines the multithreading API.
This IDL file is compiled by the QAIC IDL compiler into the following files:
multithreading.h: C/C++ header filemultithreading_stub.c: Stub source that needs to be built for the HLOS (LA/LE)multithreading_skel.c: Skel source that needs to be built for the Hexagon DSP
-
src/multithreading.cSource for the HLOS executable that calls the multithreading stub on the HLOS side to offload the compute task onto the DSP.
-
src/multithreading_imp.cSource for the Hexagon side implementation of the multithreading interface and is compiled into a shared object.
Using the walkthrough script
The walkthrough script multithreading_walkthrough.py automates the steps of signing the device, building, pushing and running the multithreading example. You can run the walkthrough script with the dry-run (-DR) option to display all the commands that the script would execute without actually running them.
Review the generic setup and walkthrough_scripts instructions to learn more about setting up your device and using the walkthrough script.
-
Analyze the output
The command window or shell should contain messages returned by the application processor when using the
printfcommand.Retrieving CDSP information using FastRPC Capability API DOMAIN_SUPPORT : 1 UNSIGNED_PD_SUPPORT : 1 Result of capability query for VTCM_PAGE on CDSP is 262144 bytes Result of capability query for VTCM_PAGE on ADSP is 0 bytes Starting multithreading test Test PASSED Please look at the mini-dm logs or the adb logcat logs for DSP output
Debugging on Simulator
This section covers the steps to debug the multithreading program.
-
Build the hexagon module using the following make command:
make hexagon BUILD=Debug DSP_ARCH=v68This generates the
multithreading_q.sofile. Alternatively, you can build the Hexagon module with CMake.build_cmake hexagon BUILD=Debug DSP_ARCH=v68 -
Define the LLDB_HEXAGON_BOOTER_PATH environment variable :
-
Linux:
export LLDB_HEXAGON_BOOTER_PATH=$HEXAGON_SDK_ROOT/rtos/qurt/computev68/sdksim_bin/runelf.pbn -
Windows:
set LLDB_HEXAGON_BOOTER_PATH=%HEXAGON_SDK_ROOT%\rtos\qurt\computev68\sdksim_bin\runelf.pbn
When
hexagon-lldbreaches the simulator launch, it checks for this environment variable and if it exists, treats therunelf.pbnin this path as the main target and picksmultithreading_q.sofile as its first argument to it. -
-
Launch the debugger
hexagon-lldbwith therun_main_on_hexagon_simbinary along with the arguments as follows:-
Linux:
$HEXAGON_SDK_ROOT/tools/HEXAGON_Tools/8.8.06/Tools/bin/hexagon-lldb $HEXAGON_SDK_ROOT/libs/run_main_on_hexagon/ship/hexagon_toolv88_v68/run_main_on_hexagon_sim -- -mv68 --simulated_returnval --usefs hexagon_Debug_toolv88_v68 --pmu_statsfile hexagon_Debug_toolv88_v68/pmu_stats.txt --cosim_file hexagon_Debug_toolv88_v68/q6ss.cfg --l2tcm_base 0xd800 --rtos hexagon_Debug_toolv88_v68/osam.cfg -- -- $HEXAGON_SDK_ROOT/examples/multithreading/hexagon_Debug_toolv88_v68/multithreading_q.so -
Windows:
%HEXAGON_SDK_ROOT%\tools\HEXAGON_Tools\8.8.06\Tools\bin\hexagon-lldb.exe %HEXAGON_SDK_ROOT%\libs\run_main_on_hexagon\ship\hexagon_toolv88_v68\run_main_on_hexagon_sim -- -mv68 --simulated_returnval --usefs hexagon_Debug_toolv88_v68 --pmu_statsfile hexagon_Debug_toolv88_v68\pmu_stats.txt --cosim_file hexagon_Debug_toolv88_v68\q6ss.cfg --l2tcm_base 0xd800 --rtos hexagon_Debug_toolv88_v68\osam.cfg -- -- hexagon_Debug_toolv88_v68\multithreading_q.so
-
-
The output of the above command must be :
Hexagon utilities (pagetable, tlb, pv) loaded Hexagon SDK device_connect command loaded (lldb) target create "/path/to/SDK_ROOT/libs/run_main_on_hexagon/ship/hexagon_toolv88_v68/run_main_on_hexagon_sim" Current executable set to /path/to/SDK_ROOT/libs/run_main_on_hexagon/ship/hexagon_toolv88_v68/run_main_on_hexagon_sim' (hexagon). (lldb) settings set -- target.run-args "-mv68" "--simulated_returnval" "--usefs" "hexagon_Debug_toolv88_v68" "--pmu_statsfile" "hexagon_Debug_toolv88_v68/pmu_stats.txt" "--cosim_file" "hexagon_Debug_toolv88_v68/q6ss.cfg" "--l2tcm_base" "0xd800" "--rtos" "hexagon_Debug_toolv88_v68/osam.cfg" "--" "--" "/path/to/SDK_ROOT/examples/multithreading/hexagon_Debug_toolv88_v68/multithreading_q.so" -
Breakpoints can be set using the following command :
b multithreading_parallel_sumThis sets the breakpoint at the entry point of the function
multithreading_parallel_sum -
Use 'r' to start running the program :
r -
The debugger stops the process at the given breakpoint and the output looks as follows :
Starting multithreading test Process 1 stopped * thread #16, name = 'ribbon', stop reason = breakpoint 1.1 frame #0: 0xd8044934 multithreading_q.so`multithreading_parallel_sum(h=14593280) at multithreading_imp.c:90:5 87 * We initialize all threads with an equal priority value of: QURT_THREAD_ATTR_PRIORITY_DEFAULT/2 (127) 88 */ 89 -> 90 qurt_thread_attr_init(&attr1); 91 qurt_thread_attr_set_name(&attr1, (char *)"cntr1"); 92 qurt_thread_attr_set_stack_addr(&attr1, malloc(1024)); 93 qurt_thread_attr_set_stack_size(&attr1, 1024); -
You can step into, step over, continue the process, obtain the register information, print the variable values and perform other functions. Some useful debugger commands are:
Command Description breakpoint list Lists the breakpoints register read Show general purpose registers for current thread thread list Lists the threads along with the thread ID and name thread backtrace Prints the stack backtrace for current thread frame info List information about the selected frame in current thread up Select stack frame that has called the current stack frame down Select stack frame that is called by the current stack frame frame variable Display a stack frame's arguments and local variables target variable Display global/static variables defined in current source file step Do a source level single step in current thread next Do a source level single step over in current thread si Do an instruction level single step in current thread ni Do an instruction level single step over in current thread finish Step out of current selected frame tlb Display the values for TLB in current thread pagetable Display the values for the pagetable in current thread memory read --size "n" "addr" --outfile "file.txt" Read "n" number of bytes from memory starting from the hexadecimal address "addr" and save the results to "file.txt" disassemble --frame Disassemble current function for the current frame image list Display the main executable and all dependent shared libraries exit To quit the hexagon-lldb debugger
Please refer to the Hexagon LLDB Debugger User Guide for more information on hexagon-lldb.