QMemCheck - NSP Memory Debug Tool
Overview
QMemCheck is an NSP Memory Debug tool that assists users in detecting memory leaks at runtime in two different ways: automated leak detection, and generation of heap block information.
Leak detection
QMemCheck checks for memory leaks at different locations in the code:
- When loading or unloading a library (if
--leak_detectis set) - When ending a Fastrpc application (if
--leak_detect_endis set) - When encountering a Leak detect marker API
Leak Detect Marker API
Note: Marker APIs and structures are exposed through HAP_mem.h from Hexagon SDK 6.0.0 onwards.
The Marker APIs are helpful to detect leaks in scenario where you suspect memory leaks to originate from a specific code region in your application.
Markers indicate the start and the end of a code section. The leak detection tool will identify leaks that occur between those markers.
QMemCheck supports (2^16)-1 marker instances in a single application.
Use the HAP_mem_request API to set a marker, as illustrated in the example below.
Sample Code
START marker will return the instance number in the payload structure. This instance number should be saved and should be used while filling the END marker's payload.
HAP_mem_req_payload_t mem_payload;

/*
* HAP_MEM_SET_MARKER is the request id for setting marker.
*/
mem_payload.request_id = HAP_MEM_SET_MARKER;

/*
* START is the marker type for starting one instance of leak detection
*/
mem_payload.mem_marker_payload.marker_type = START;

/*
* HAP_mem_request for START marker will set the instance number
* mem_payload.mem_marker_payload.instance to a unique value, which will need to be passed when specifying the END marker
* HAP_mem_request return 0 on success or -1 on failure.
*/
int nErr1 = HAP_mem_request(&mem_payload);
.
.

/**user code**/

.

/*
* END is the marker type for ending one instance of leak detection
* Either reuse the mem_payload object as shown in this example, or create a new one with mem_payload.mem_marker_payload.instance set to the value returned when creating the START marker
*/

mem_payload.mem_marker_payload.marker_type=END;

/*
* HAP_mem_request for END marker with the instance number in payload
* will report all leaks between start and end of this instance.
*/
nErr1 = HAP_mem_request(&mem_payload);
Heap Block Information
HAP API can be called from the application code to get the Heap block information.
Heap Block Info APIs and structures are exposed through HAP_mem.h from Hexagon SDK 6.0.0 onwards.
Use the HAP_mem_request API to request heap block information, as illustrated in the example below.
Sample Code
HAP_mem_req_payload_t mem_payload;
/*
* HAP_MEM_LOG_BLOCKS is the request id for getting all block info.
*/
mem_payload.request_id = HAP_MEM_LOG_BLOCKS;
/*
* HAP_mem_request for HAP_MEM_LOG_BLOCKS will report all the heap
* blocks (used and free blocks) at this point of time.
* For used blocks, caller addresses will also be reported.
*/
HAP_mem_request(&mem_payload);
For further details, please refer to the section on heap block information
How it works
- Configure the leak detection mode, caller level, and caller stack depth for the application.
- Set up the environment for application execution.
- Deploy the application on the device and execute it.
- The DSP heap leak detection algorithm will identify potential leaks and generate an output file with leak information for the application.
- Pull the generated output file (referred to as the parser input file).
- Parse the parser input file to obtain the load addresses of the libraries.
- Execute readelf on all the libraries and store the information in the symbol table.
- For each caller pointer in the parser input file, check the load addresses of all the loaded libraries.
- Walk through the symbol table of the library whose start address is within the range of the caller pointers.
- Display or write the symbol name of the symbol table entry whose offset is closest to the caller pointer to the parser output file, along with other block information.
Help
python qmemcheck.py -h
Usage:
qmemcheck.py [-h] [-l] [-i / -p] [--app] [--arg] [--host] [--U32] [--lib_load] [--leak_detect / --leak_detect_end]
             [-s][--callerlevel CALLER_LEVEL] [--num_call_stack CALLER_STACK_NUMBER] [--env] [--aggregate]
note: -l is mandatory for running the script along with one the following options:
* [--app] [--arg] [--leak_detect / --leak_detect_end]
* [-i]
* [-p]
Other arguments:
-h, --help                      show this help message and exit
-l {libraries}                  Name of the libraries for fetching the symbol name
                        note: libraries must be present in the tool folder

-i {file_path}                  location of dev_output file to parse
-p {dir_to_parse}               location of directory where dev_output file is present
-s {device_serial_number}       Device ID. ex. ADB serial number for LA & LE devices (default: None)
--app={app_name}                application/executable name
--arg={arguments}               argument required to execute the application
--host={ip_addr}                IP address of the host machine where the device is connected
--U32                           Specify only if the application required 32 bit libraries(default: False)
--lib_load                      Specify only if required to push libraries and app on to the device, before execution
                        note: The application and libraries must be present in the tool folder

--leak_detect/leak_detect_end   leak detect flag to configure
--callerlevel                   Specify the caller level as debug configuration(default: 1)
--num_call_stack                Specify Number of caller levels(1-7) as debug configure (default: 1)
                        note: Either num_call_stack or callerlevel can be used

--env={environment_variables}   Set the env variables required for app execution(Default: System default path)
--aggregate                     Aggregate the caller symbols

--dev_dir={dev_app_load_path}   Specify only if the device default path is readonly
                                or if required to execute form different location (default: None)
                        note: This option is only applicable if --lib_load is used
Setup
Set the SDK environment as described here.
Usage examples
Upon execution, an output folder named with the prefix 'hprt' followed by the application name is generated. The leak information is both saved in a CSV file and displayed on the terminal.
For example, hprt_application_name/output/hprt_leak_block_info*_proc.csv
Application execution using default configuration
In the default configuration, the qmemcheck tool configures only the leak detection mode for the application and then executes it.
python qmemcheck.py -l "{library names[_must be in the tool directory_]}" --app="application_name" --arg={argment required for execution}" --leak_detect_end/--leak_detect
Example:
python qmemcheck.py -l "libfastrpc_tests_skel.so" --app="fastrpc_tests" --arg="-d 3 -T 108" --leak_detect_end
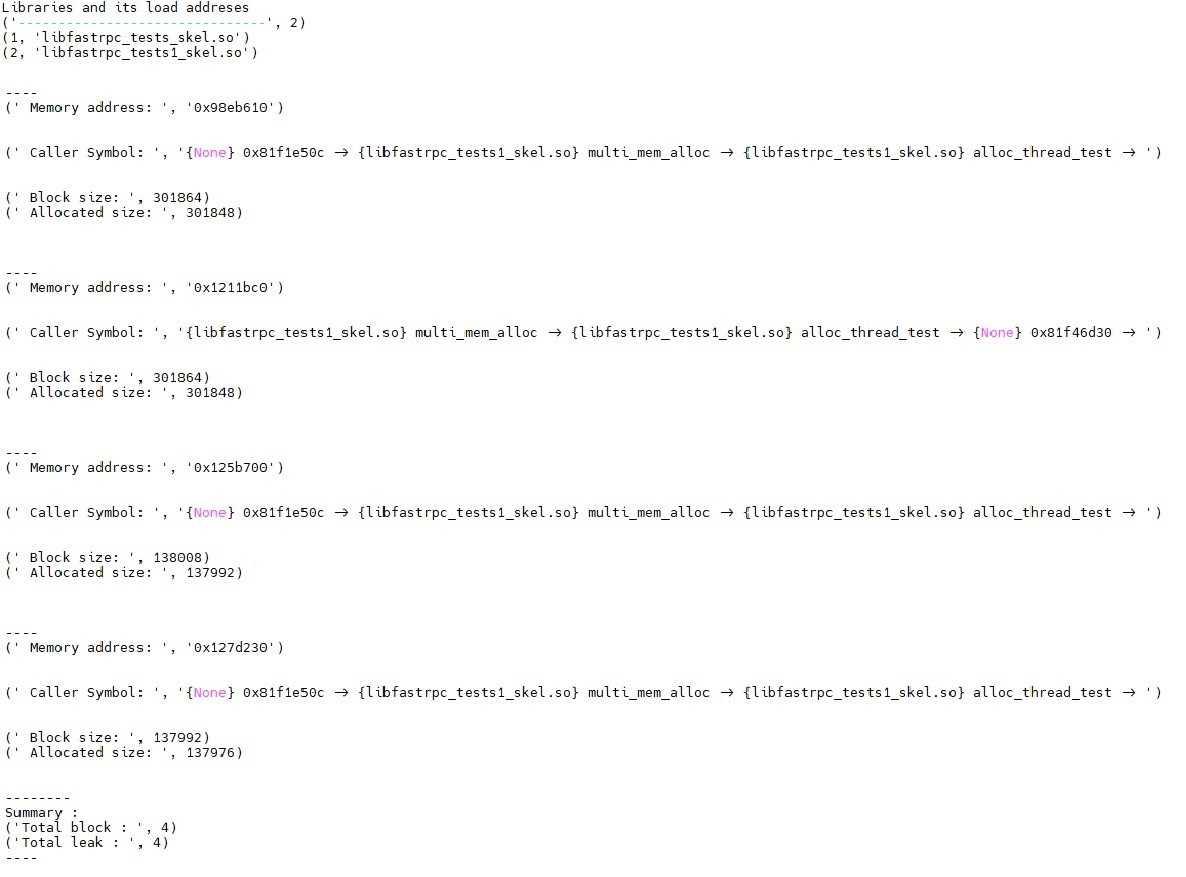
Expected behavior:
When the qmemcheck tool is executed without specifying any caller level or caller stack size, the report generated will include the default or preconfigured caller level and caller stack size details.
For example, hprt_fastrpc_tests/output/hprt_leak_block_info*_proc.csv
Sample output:
Application execution with configuration
Users can configure the caller level and caller stack size at runtime by passing the arguments to the qmemcheck tool.
Note: Either the caller level or the caller stack size can be configured at one time. If the caller stack size is set, the caller level configuration will be ignored.
python qmemcheck.py -l "{library names[_must be in the tool directory_]}" --app="application_name" --arg={argment required for execution}" --leak_detect_end/--leak_detect --callerlevel={caller level number} --num_call_stack={number of caller stack}
Example:
python qmemcheck.py -l "libcalculator_skel.so libcalculator.so" --app="calculator" --arg="-r 0 -n 1000" --leak_detect --num_call_stack=7
Expected behavior:
When the qmemcheck tool is executed with specified caller level or caller stack size, the report generated will include the user-configured caller level and caller stack size details.
For example, hprt_fastrpc_tests/output/hprt_leak_block_info*_proc.csv
Application load and execution
The lib_load argument loads the executable and necessary libraries onto the device, sets the environment, and configures and executes the application.
Note: If the lib_load argument is not passed to the qmemcheck tool, it will configure and execute the preloaded application.
python qmemcheck.py -l "{libraries with path}" --app="{application with path}" --arg="{argment required for execution}" -H {host_name[_if required_]} --leak_detect_end/--leak_detect --lib_load
Example:
python qmemcheck.py -l "/local/mnt/workspace/Qualcomm/Hexagon_SDK/5.3.0.0/examples/calculator/hexagon_Debug_toolv86_v65/ship/libcalculator_skel.so /local/mnt/workspace/Qualcomm/Hexagon_SDK/5.3.0.0/examples/calculator/android_Debug_aarch64/ship/libcalculator.so" --app="/local/mnt/workspace/Qualcomm/Hexagon_SDK/5.3.0.0/examples/calculator/android_Debug_aarch64/ship/calculator" --arg="-r 0 -n 1000" -H <_host_name_> --leak_detect_end --callerlevel=3 --lib_load
Expected behavior:
When the qmemcheck tool is executed with the load option along with any other argument, the load option does not impact the generated output. The report is generated according to the other arguments passed.
Analyzing the parser input file
python qmemcheck.py -l "{library names[_must be in the tool directory_]}" -i {file name with path}
Example:
python qmemcheck.py -l "libbenchmark.so benchmark_q.so libbenchmark_async_skel.so libbenchmark_queue_dsp_skel.so libbenchmark_skel.so libc++_shared.so" -i hprt_benchmark/hprt_leak_block_info_3205_libbenchmark_skel.so.csv
Expected behavior:
The report is generated based on the pre-generated parser input file and will be saved in the output folder, which is created in the qmemcheck tools directory.
For example, Hexagon_SDK/6.0.0.2/utils/qmemcheck/output/hprt_leak_block_info*_proc.csv
Analyzing multiple parser input files
python qmemcheck.py -l "{library names[_must be in the tool directory_]}" -p {path where the files are present}
Example:
python qmemcheck.py -l "libbenchmark.so benchmark_q.so libbenchmark_async_skel.so libbenchmark_queue_dsp_skel.so libbenchmark_skel.so libc++_shared.so" -p hprt_benchmark
Expected behavior:
Multiple reports will be generated based on the pre-generated parser input files and will be saved in the output folder, which is created in the multi-file location specified as an argument to the qmemcheck tool.
For example, hprt_benchmark/output/hprt_leak_block_info*_proc.csv
Aggregate option
The aggregate option helps users combine multiple leak caller symbols.
python qmemcheck.py -l "{library names[_must be in the tool directory_]}" --app="application_name" --arg={argment required for execution}" -H {host_name[_if required_]} --leak_detect_end/--leak_detect --num_call_stack={number of caller stack} --aggregate
Example:
python qmemcheck.py -l "libcalculator_skel.so libcalculator.so" --app="calculator" --arg="-r 0 -n 1000" -H <_host_name_> --leak_detect --callerlevel=1 --num_call_stack=1 --aggregate
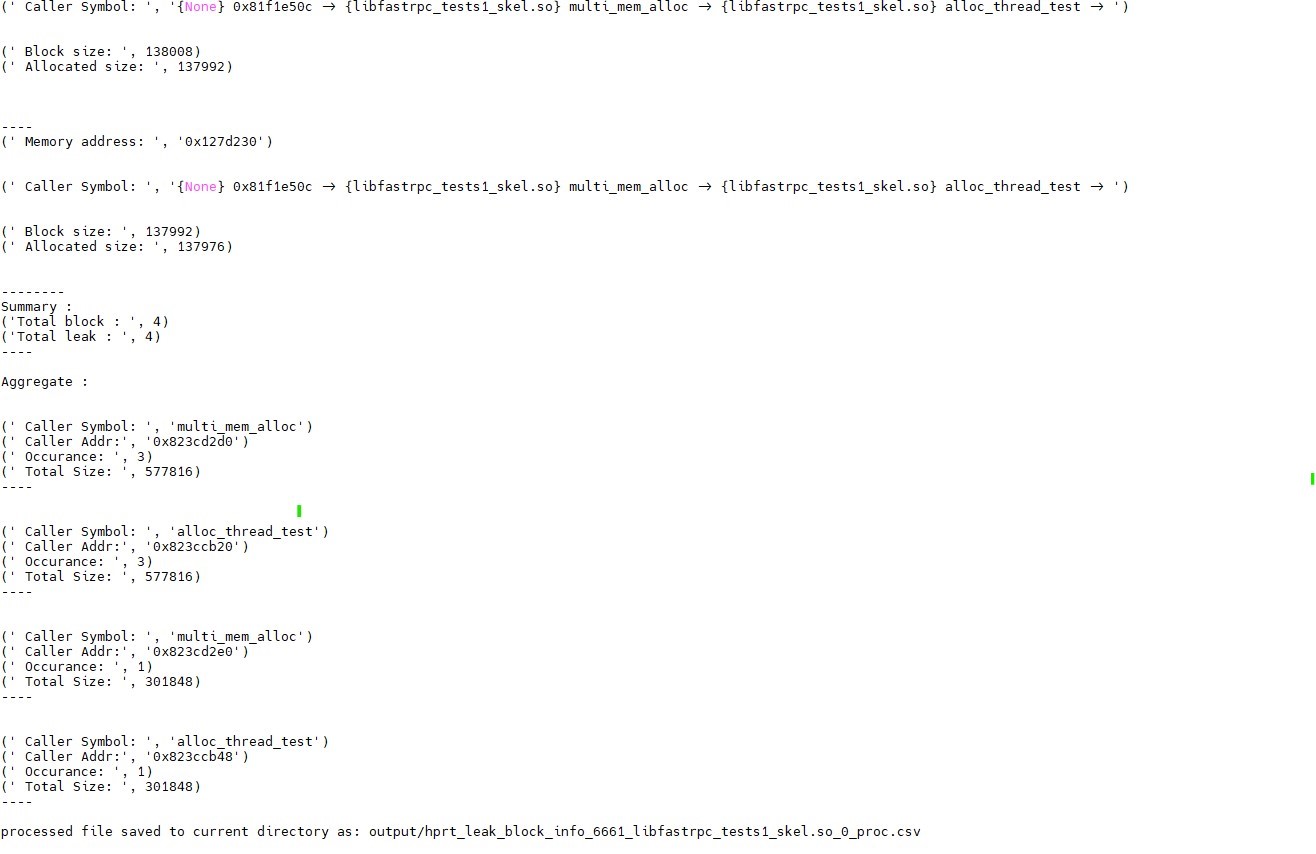
Expected behavior:
When the aggregate option is used as a command line argument to invoke the qmemcheck tool, the report generated by qmemcheck tool will also include additional details, as demonstrated in the sample output below.
Additionally, aggregated leaks are saved in CSV files and displayed on the terminal.
For example, hprt_fastrpc_tests/output/hprt_leak_block_info*_aggregate.csv
Sample output:
Using environment variables
If an application execution requires any environment variables to be configured, they can be set using the env argument.
python qmemcheck.py -l "{library names[_must be in the tool directory_]}" --app="application_name" --arg={argment required for execution}" -H {host_name[_if required_]} --leak_detect_end/--leak_detect --num_call_stack={number of caller stack} --aggregate --env="{environment_variables}"
Example:
python qmemcheck.py -l "libcalculator_skel.so libcalculator.so" --app="calculator" --arg="-r 0 -n 1000" -H <_Host_name_> --leak_detect --callerlevel=1 --num_call_stack=1 --aggregate --env="LD_LIBRARY_PATH=/vendor/lib64/ DSP_LIBRARY_PATH=/vendor/lib/rfsa/adsp/"
Expected behavior:
When the qmemcheck tool is executed with the env option along with any other argument, the env option does not impact the generated output. The report is generated according to the other arguments passed.
Leak Detection via Marker API
python qmemcheck.py -l "{library names[_must be in the tool directory_]}" --app="application_name" --arg={argment required for execution}" -H {host_name[_if required_]} --callerlevel={caller level number} --num_call_stack={number of caller stack}
Example:
python qmemcheck.py -l "libfastrpc_tests_skel.so" --app="fastrpc_tests" --arg="-d 3 -T 108" --callerlevel=1
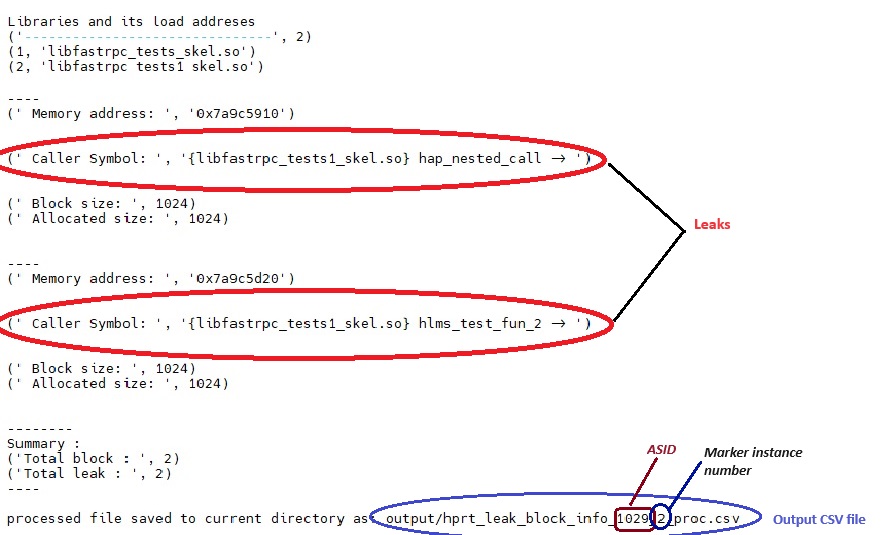
Expected behavior:
When the code is instrumented with marker APIs, there is no need to modify the command line that invokes qmemcheck tool. However, the report generated by qmemcheck tool will also include additional details, as demonstrated in the sample output below.
Leak information is exported to a CSV file, suffixed with the marker instance number and followed by 'proc.csv', and also displayed on the terminal.
For example, hprt_fastrpc_tests/output/hprt_leak_block_info*<_instance_number>_proc.csv {instance number : 1,2,3...})
Sample output:
Heap Block Information via Block Information API
python qmemcheck.py -l "{library names[_must be in the tool directory_]}" --app="application_name" --arg={argment required for execution}" -H {host_name[_if required_]} --callerlevel={caller level number} --num_call_stack={number of caller stack}
Example:
python qmemcheck.py -l "libfastrpc_tests_skel.so" --app="fastrpc_tests" --arg="-d 3 -T 108" --num_call_stack=3
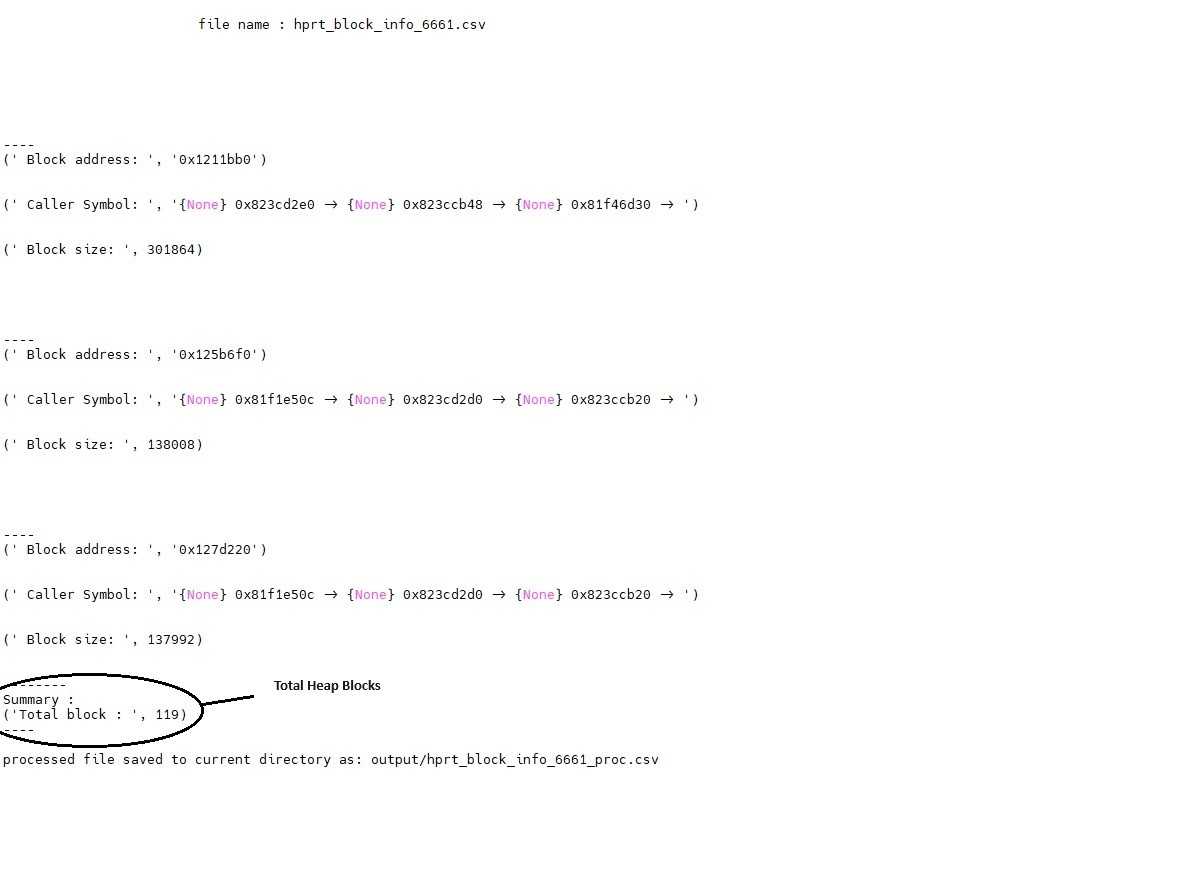
Expected behavior:
When the code is instrumented with block information APIs, there is no need to alter the command line that invokes the qmemcheck tool. However, the report generated by the qmemcheck tool will include these details, as shown in the sample output below.
Sample output: